The Geometric and Hydraulic Simulation of Detention Dams by Integrating HEC-HMS and GIS (Case Study: Neka River Drainage Basin)
Arman Shabani Bazneshin1 * , Alireza Emadi1 and Ramin Fazl Ola1
1
Department of Water Engineering,
Sari Agricultural Science & Natural Resources,
Sari,
Iran
http://dx.doi.org/10.12944/CWE.10.Special-Issue1.102
Floodwater is a natural and integral part of people's life in all urban and rural societies. Therefore, providing strategies for controlling this natural phenomenon and reducing its damages is necessary. Construction of detention dams is one of the structural methods for controlling floodwaters which is studied in this article. In the present research, Neka river drainage basin was selected and HEC-HMS software was used for simulating the reservoir. In HEC-HMS software, it is necessary to define a method for routing the reservoir, determining the height and type of the outlet structure, determining reservoirs' level-height equations, etc. After completing the required information and implementing the model, floodwater hydrographs were compared in both before and after situations. Results showed that HEC-HMS software can be used as a powerful tool in the geometric and hydraulic simulation of detention and storage dams in designing hydraulic projects.
Copy the following to cite this article:
Bazneshin A. S, Emadi A, Ola R. F. The Geometric and Hydraulic Simulation of Detention Dams by Integrating HEC-HMS and GIS (Case Study: Neka River Drainage Basin). Special Issue of Curr World Environ 2015;10(Special Issue May 2015). DOI:http://dx.doi.org/10.12944/CWE.10.Special-Issue1.102
Copy the following to cite this URL:
Bazneshin A. S, Emadi A, Ola R. F. The Geometric and Hydraulic Simulation of Detention Dams by Integrating HEC-HMS and GIS (Case Study: Neka River Drainage Basin). Special Issue of Curr World Environ 2015;10(Special Issue May 2015).
Available from: http://cwejournal.org?p=711/
Download article (pdf)
Citation Manager
Publish History
Introduction
Flood is an integral and natural part of people's life in all urban and rural societies. Some floodwaters are seasonal and mainly happen in summer or at the beginning of spring, and quickly transfer a significant amount of runoff resulting from rainfall and snowmelt to rivers in the drainage basin. Some other floodwaters are sudden and abrupt, uprise along the river and lead to the washout and corrosion of all barrios in the way. Construction of reservoirs is one of the structural methods for controlling the floodwater. The purpose of constructing reservoirs is to control or mitigate flood and reduce the peak discharge of flood. This purpose is practically possible through saving the flood flow in the reservoir. Flood control reservoirs can be divided into two groups of storage reservoirs and detention reservoirs (Mirmomen., 2007). Floodwater control using detention reservoirs has a direct and quick effect on the floodwater. If topography allows creating a storage reservoir with a proper volume and if there are available materials (borrow sources) at a little distance from the research location, the storage reservoir can be used due to its rapid effect on the floodwater mitigation compared to watershed methods (Kholghi., 2001). (Kholghi., 2001) studied the optimal watershed management in the implementation of corrective dams. The research aimed to provide and introduce a strategy that mathematically prioritized subbasins from floodwater control and corrective dams’ construction points of view. For optimizing the floodwater control in Neka river drainage basin, (Shabani Bazneshin et al., 2013) used the structural method of constructing detention dams. For this reason, first they extracted the region’s digital elevation map in GIS. Then, using HECGeo-HMS rider, they performed the geometric simulation of Neka river basin and finally used HEC-HMS for the hydraulic simulation as well as reservoirs’ simulation. (Behbahani et al., 2006) started to position Lorestan reservoirs using HS-AHP method, Geometric Information System (GIS) and HEC-HMS hydraulic model. For this reason, after collecting basic information, they implemented HS-AHP method in three steps. In the first step, they used GIS software for extracting waterway networks and preparing DEM model. In the second step, they used HEC-HMS hydraulic model for the hydraulic simulation of basins in order to estimate the runoff and water balance of drainage basins and the amount of runoff and losses in this model were estimated using US Soil Conservation Service (SCS) method. (Shokouhi et al., 2006) studied two different methods for controlling the floodwater. One of these methods is the construction of detention dams at the upstream of the urban basin and the other is taking measures relating to the river engineering in the urban basin. For the hydraulic simulation of the basin, HEC-HMS model was used. Their result showed that by constructing reservoirs, the amount of output discharge and the amount and cost of river engineering measures in urban basins will significantly reduce and the safety factor will increase in the above regions. (Mirmahdi and Jahangiri., 2008) calibrated and evaluated HEC-HMS model in responding to Maroon river drainage basin measuring 3824 square kilometers in area in Khuzestan province. For calculating the runoff, they used three methods of SCS, Snyder and Clark and after comparing the simulated hydrographs with observed ones in three hydrometric stations in the area, they found out that SCS, Snyder and Clark methods had the minimum difference in flood peak discharge and peak reaching time, respectively. (Knebl et al., 2005) presented a regional model of floodwater in San Antonio river basin (about 10000 square kilometers) located at Texas State in USA and selected the flood event in summer 2002. In this regional model, they used HEC-HMS software for converting the additional precipitation to the runoff and used HEC-RAS software for modeling the variable flow along the river. Results showed that this modeling could be used as a tool for the hydrologic prediction of flood at a regional scale. (Perez Pedini et al., 2005) optimized the effective locations for conducting activities relating to the flood control. For this reason, they developed HRUs hydrologic model, combined it with the genetic algorithm and finally determined optimal locations. (Tarvis and Mays., 2008) optimized detention reservoirs network. In this research, they looked for locations for constructing the reservoir where the geological structure of reservoir had the capability of water penetration and discharge. The research aimed to determine the location and size of these reservoirs. For this purpose, they used dynamic programming (Tarvis and Mays., 2008). In the research, first the geometric simulation of Neka river drainage basin was done using HECGeo-HMS and after the formation of waterways and extraction of the required physiographic features, the hydrologic simulation was done in HEC-HMS environment. For simulating detention reservoirs, first appropriate situations were determined in order to construct reservoirs based on the topography map, and after specifying the location of dam construction, level-height curves were extracted in GIS environment. Finally, by entering information to HEC-HMS, reservoirs were simulated.
Materials and Methods
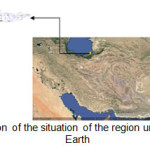
Situation of the Region Under Study
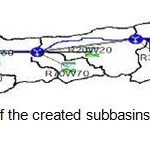
The region under study is Neka river drainage basin located at the easternmost side of Mazandaran province which flows along the north-south side of the Caspian Sea. Neka River enters Neka city from the southeast; then, after huge mazes, it exits the city from the west side with the average slope of 0.365% and by passing a distance about 30 kilometers from Ablo station, it enters the Caspian Sea. This basin is approximately located at 53Ëš and 17 minutes to 54Ëš and 44 minutes of the eastern longitude and 36Ëš and 28 minutes to 36Ëš and 42 minutes of the northern latitude (Iran Water Resources Management Organization, 2008). In figure 1, the region under study is displayed using Google Earth software.
 |
|
The Geometric Simulation of Basin
In order to geometrically simulate Neka basin, first the topography map of the region with 1/50000 scale was entered in Arc View software and after correcting defects, Triangular Irregular Network (TIN) model was prepared. Then, the region’s digital elevation model was created with 5 meters dimensions in Arc View environment using TIN. By using the created DEM, the flow direction map was made. This map makes it clear that the water in every cell flows to which near cells. Using the flow direction map and GIS functions, the flow accumulation map was also made. These maps are significant in creating the primary waterway network and subbasins. After extracting the above maps, the primary and secondary waterway networks of Neka river drainage basin were extracted and used for dividing basins into subbasins. Finally, based on the threshold number entered in HECGeo-HMS, Neka basin was divided into 9 subbasins which are shown in figure 2.
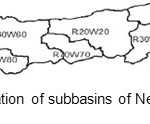 |
Figure 2: The presentation of subbasins of Neka river drainage basin Click here to View figure |
After determining the scope of subbasins of Neka river drainage basin, physiographic features of each one required in the study was extracted, including the number of penetration curve, concentration and detention time, figures of the highest and lowest points of each subbasin, etc. Finally, the file of subbasins and waterways network necessary for the HEC-HMS-based hydrologic simulation was prepared.
The Hydrologic Simulation of Basin
For the hydrologic simulation of Neka river drainage basin, after entering geometric information of the basin extracted by HECGeo-HMS, time series of rainfall with different return periods calculated by long-term statistical analysis of 24-hour rainfalls were entered in the software and after presenting the hydrograph method of SCS unit for calculating the flood hydrograph and CN curve number method for calculating rainfall losses as well as determining the time step for drawing the hydrograph, HEC-HMS model was implemented and flood hydrographs were extracted for different return periods. Based on the existing standards in designing detention reservoirs, it is observed that in small urban and rural basins, the return period of 15 years and in large urban basins and important commercial and industrial regions, the return period of 100 or 1000 years are used for calculating the flood in the design. In this research, for the simulation of detention reservoirs, the flood with the return period of 15 years is used.
Simulation of Detention Reservoirs
According to studies conducted in Neka river drainage basin, R70W70, R80W80 and R60W60 subbasins have the maximum proportion in the formation of the flood leaving the basin and are critical subbasins (Shabani Bazneshin et al., 2014). Therefore, taking flood control measures and constructing detention reservoirs are necessary in these three subbasins. For constructing detention reservoirs, first their construction location is determined. The best economical location for constructing detention reservoirs with the maximum effect on the floodwater control has the following characteristics:
- Locations with narrowing valleys which are recognizable on the topography map. In fact, 2- locations where topography lines are close to each other are the best locations for constructing reservoirs.
- Detention reservoirs have the maximum efficiency in reducing the peak discharge and increasing the time delay when they are closer to the basin outlet.
- An appropriate storage volume is created behind the dam axis for the reservoir.
The location of dam construction is in the primary waterway .
In figure 3, for example the location of dam axis construction in R70W70 subbasin is presented.
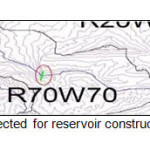 |
Figure 3: The location selected for reservoir construction in R70W70 subbasin Click here to View figure |
After locating dams construction depending on the abovementioned characteristics, their level-height curves were extracted in GIS and entered in the model. For the hydraulic simulation of reservoirs, the routing method was used based on the type of outlet structure defined in HEC-HMS software. The type of outlet structure for the detention dam in this research is the broad-crested weir. After entering the geometric information relating to the dam, including the length of dam crest, height, etc., the model was performed and dam input and output hydrographs were compared.
Results
Results of the Geometric Simulation of Basin
For the geometric simulation of basin, first the basin’s digital elevation map was extracted using the topography map 1/50000 shown in figure 4.
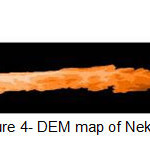 |
Figure 4: DEM map of Neka basin Click here to View figure |
After the geometric simulation of basin and dividing the basin into subbasins, the basin’s waterways network was extracted through the software shown in figure 5.
 |
|
Finally, the physiographic features of each subbasin were extracted which are presented in table 1.
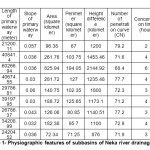 |
Table 1: Physiographic features of subbasins of Neka river drainage basin Click here to View table |
Results of Hydrologic Simulation of Basin
After extracting physiographic features of subbasins, the required information for the hydrologic simulation of basin and determination of flood hydrographs of basin and subbasins were entered in the software and floodwater hydrographs were simulated for different return periods. Peak discharge values of the output flood of subbasins are presented in table 2.
Table 2: Peak discharge values of the output floodwater hydrograph of Neka river drainage subbasins
|
Return period (year) |
2 |
10 |
15 |
25 |
50 |
100 |
|
Subbasin |
Flood peak discharge (cubic meters per second) |
|||||
|
R10W10 |
17.86 |
67.07 |
80.98 |
99.91 |
126.45 |
155.31 |
|
R20W20 |
61.57 |
215.89 |
256.95 |
312.02 |
388.85 |
469.49 |
|
R30W30 |
26.71 |
93.69 |
111.94 |
136.53 |
171.14 |
207.86 |
|
R40W40 |
63.43 |
258.20 |
312.81 |
386.52 |
490.37 |
601.05 |
|
R50W50 |
28.79 |
122.78 |
150.68 |
190.59 |
247.99 |
311.20 |
|
R60W60 |
52.97 |
195.37 |
234.67 |
288.15 |
364.22 |
445.36 |
|
R70W70 |
12.58 |
60.92 |
75.35 |
96.83 |
128.43 |
163.91 |
|
R80W80 |
23.59 |
94.29 |
114.22 |
141.86 |
181.38 |
223.78 |
|
R90W90 |
22.35 |
107.07 |
131.34 |
164.51 |
212.42 |
264.51 |
|
Outlet |
110.76 |
448.56 |
543.00 |
669.65 |
847.01 |
1035.57 |
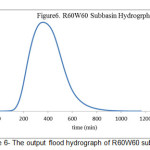
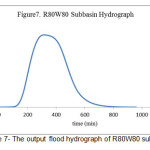
For designing detention reservoirs based on the land use, the flood with the return period of 15 years was used and the output flood hydrograph of subbasins under study were presented in figures 6 to 8.
 |
|
 |
|
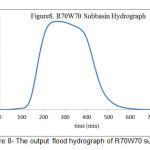 |
Figure 8: The output flood hydrograph of R70W70 subbasin Click here to View figure |
Results of Reservoir’s Simulation
During the studies conducted for prioritizing subbasins of Neka river drainage basin from flooding potential point of view, it was determined that R70W70, R80W80 and R60W60 subbasins had the maximum proportion in the flood formation at the basin outlet (Shabani Bazneshin et al.,2014). Therefore, reservoirs simulation was done in the above mentioned subbasins. For determining the length of dam axis, the valley’s width was measured using GIS and the broad-crested weir was selected as the type of outlet structure for all dams.
Table 3: Specifications of reservoirs constructed at critical subbasins
|
Situation of reservoir construction |
Dam crest length (meter) |
Type of spillway |
Spillway length (meter) |
Height (meter) |
|
R70W70 subbasin |
28 |
broad-crested |
28 |
7 |
|
R60W60 subbasin |
21 |
broad-crested |
21 |
9 |
|
R80W80 subbasin |
25 |
broad-crested |
25 |
15 |
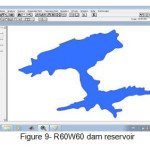 |
Figure 9: R60W60 dam reservoir Click here to View figure |
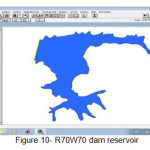 |
Figure 10: R70W70 dam reservoir Click here to View figure |
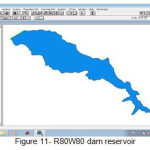 |
Figure 11: R80W80 dam reservoir Click here to View figure |
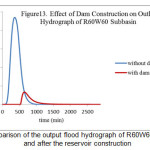
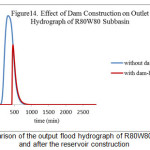
By simulating the reservoir in HEC-HMS software and implementing the model, it was observed that reservoirs construction in R70W70, R80W80 and R60W60 subbasins has a significant effect on the reduction of output peak discharge of the basin. Results of reservoirs’ construction in the above mentioned subbasins are shown in figures 12 to 14.
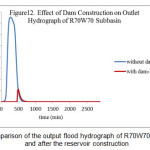 |
Figure 12: Comparison of the output flood hydrograph of R70W70 subbasin before and after the reservoir construction Click here to View figure |
 |
|
 |
|
In table 4, the comparison of floodwater hydrographs is presented in two states of before and after the dam construction.
Table 4: Comparison of the peak discharge and the time of occurrence of peak discharge before and after reservoirs’ construction in critical subbasins
|
Situation of dam construction |
Discharge before dam construction (cubic meters per second) |
Discharge after dam construction (cubic meters per second) |
Time of occurrence of peak discharge before dam construction (minute) |
Time of occurrence of peak discharge after dam construction (minute) |
|
R70W70 subbasin |
75.3 |
11.3 |
265 |
490 |
|
R60W60 subbasin |
234.7 |
33.4 |
360 |
645 |
|
R80W80 subbasin |
114.2 |
76.9 |
315 |
460 |
Conclusion
The reduction of peak discharge and increase of the time of its occurrence were the flood control projects’ objectives which had a significant effect on the reduction of casualties and financial losses resulting from the floodwater. In order to control the floodwater at Neka basin, three subbasins which affected the increase of the floodwater in this basin were selected and the effect of detention dam construction was studied. Study results showed that detention dam construction reduced the peak discharge about 101 cubic meters per second and the delay time was increased 3.6 hours on average. Therefore, HEC-HMS software can be used as a powerful tool in the geometric and hydraulic simulation and design of detention dams.
References
- Mirmomen, S.S. Study of the optimal dimensions of integrating detention reservoirs with their main downstream drainage channel and study of the effect of floodwater characteristics on the optimal cost and dimensions, MSc thesis in Irrigation and Drainage Engineering, Tehran University, Tehran, (2007).
- Garcia, J.D. Basic Criteria for Sizing Large Dam Spillways, ICOLD, 16th Conf, Q. 63, R.65, Paris, pp: 1106-1093, (1988).
- Kholghi, M. The optimal watershed management in the implementation of corrective dams, the first national conference of watershed and water extraction management in watershed basins, Bushehr, p 6, (2001).
- Shabani Bazneshin, A. Application of the genetic optimization algorithm in the optimal location of detention dams, MSc thesis of hydraulic structures, Department of Water Engineering, Sari Agricultural Science & Natural Resources University, (2013).
- Behbahani, S.M.R., Nazari, B.V. and Nazarifar, M.H. Location of hydraulic reservoirs using HS-AHP and GIS methods (case study of Lorestan province), the second conference of water resources management, p 8, (2006).
- Shokouhi, A., Daneshvar, Sh. And Behrouznia, M.R. Study of the effect of detention dams and river engineering operations on the floodwater control of urban basins, the seventh international seminar of river engineering, Shahid Chamran University of Ahvaz, Ahvaz, Iran, p 8, (2006).
- Mirmahdi, M. and Jahangir, A. Calibration of HEC-HMS mathematical model and evaluation of this model in response to Maroon drainage basin floodwater, the forth national conference of civil engineering, Tehran University, Tehran, Iran, p 7, (2008).
- Knebl, M.R.; Yang, Z.L.; Hutchison, K.; and Maidment, D.R., Regional Scale Flood Modeling Using NEXRAD Rainfall, GIS, and HEC-HMS/RAS (Case Study for the San Antonio River Basin Summer 2002 Storm Event, Journal of Enviromental Management, pp 325-336, (2005).
- Perez Pedini, C.; Limbrunner, J.F.; and Vogel, R.M., Optimal Location of Infiltration-Based Best Management Practices for Storm Water Management, Journal of Water Resources Planning and Management, 131(6), pp 441-448, (2005).
- Tarvis, Q.B.; and Mays, L.W. Optimizing Retention Basin Networks, Journal of Water Resources Planning and Management, 134(5), pp432-439, (2008).
- Iran Water Resources Management Organization. The report of Neka river drainage basin’s flood in August 1999, p 112, (2008).
- Shabani Bazneshin, A.; Emadi, A.; and FazlOla, R., Prioritization of the flooding potential of drainage basins (case study: Neka river drainage basin), scientific-research journal of watershed management, in press, Sari Agricultural Science & Natural Resources University, (2014).


